
Core Monitoring Capabilities
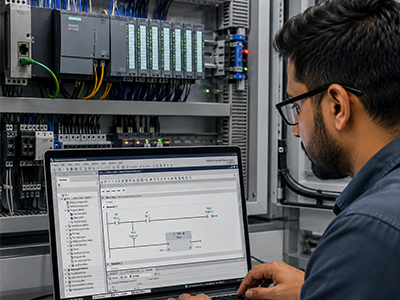
Energy Management
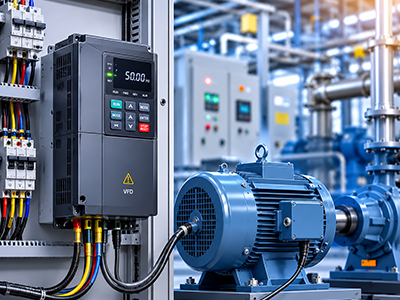
Water Quality Monitoring
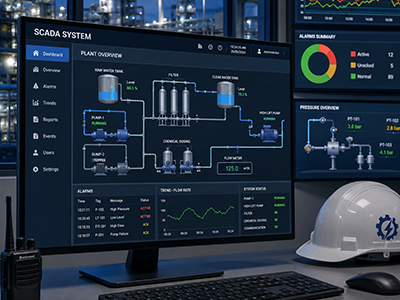
Steam Monitoring
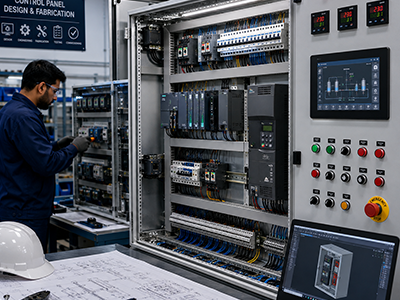
HVAC Management
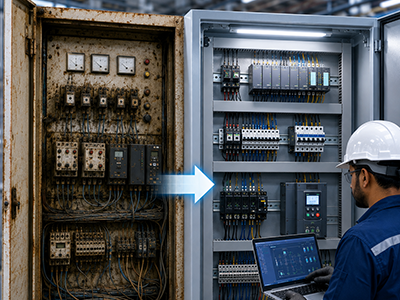
Air Monitoring
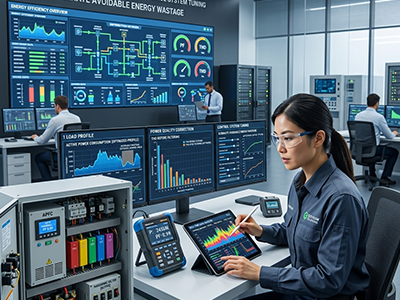
Equipment & Assets Management
Industries Served

Textile

Pharmaceuticals

Automotive

Government & Infrastructure

Steel

Food & Beverage
Our Case Studies
Proven solutions, Reliable performance, Real-world result
CASE STUDY 1
Water Quality Monitoring & Automated RO Control for Raymond Luxury Cottons, Amravati
Client Industry
Textile Manufacturing
Problem Statement:
TDS and pH monitoring for process water was being carried out manually, requiring operator time and creating a risk of delayed response if water quality drifted out of range before reaching the RO system.
Our Solution:
Deployed automated TDS + pH monitoring at two critical tank locations, connected to the IO Sense cloud IoT platform. When TDS exceeds a defined 200 ppm threshold, the system automatically closes the RO inlet solenoid valve. The platform also provides real-time dashboards, historical trends, event logs, automated MIS reports, and SMS + email alerts.
Results Delivered:
Reduced manual monitoring and operator time, faster response to abnormal readings via threshold alerts, and an automatic control layer against out-of-spec water reaching the process. Implemented and commissioned in 7 days.
CASE STUDY 2
IIoT-Based Energy Management System for RC Plasto, Nagpur
Client Industry
Plastic Pipe & Tank Manufacturing
Problem Statement:
33 existing energy meters across four plant areas (CTPT Room, New Pipe Plant, Tank Plant, Existing Pipe Plant) produced data with no consolidated view — plant personnel needed to physically check meters, and management had no single dashboard for energy performance.
Our Solution:
Connected all 33 meters via Modbus RS-485 communication to IIoT Ethernet gateways with Ethernet/4G connectivity, feeding a cloud-based energy management platform. The platform delivers real-time monitoring of Energy, Power, Voltage, Current and Power Factor, intelligent alerts, a centralized analytical dashboard, historical reporting, and web/mobile access — with local data storage during internet outages.
Results Delivered:
Centralized energy visibility across all 33 meters in one digital environment, reduced dependence on manual meter reading, faster identification of abnormal conditions, and a scalable architecture for adding further meters or points.
Join Our Community
Ready to Make Your Plant Smarter? Request a Free IIoT Readiness Assessment.